


Incorporating a Total Portfolio Approach
A Total Portfolio Approach, or TPA, naturally dismantles the siloed decision-making of an asset class approach to portfolio construction. It instead measures how each position, across different asset classes, contributes to the portfolio’s holistic exposure via one common language of risk. This realigns an investment process back to what really matters: total portfolio outcomes.
Part 1
What is an Asset Class Approach?
Is the traditional method of investment allocation limiting investors' understanding of true portfolio risk?
The traditional strategy, sometimes referred to as an "asset class approach" (ACA), establishes a target allocation across asset categories like equities, bonds, hedge funds, and private debt, aiming for positive returns and diversification. This method gained traction in the 1950s when Harry Markowitz introduced Modern Portfolio Theory.
As a result, research, market commentary, and media broadly discuss markets through the lens of asset classes. For practitioners, structuring portfolios by asset class is intuitive and allows for straightforward allocation analysis and decision-making. However, a reliance on just an ACA could stem more from habit and convenience and may not deliver a deep understanding of risk and diversification.
Part 2
Challenges of an Asset Class Approach
One of the most straightforward examples of asset class allocation is the 60/40 portfolio, comprising 60% equities and 40% bonds. While this approach is intuitive, it also requires careful consideration. For example:
-
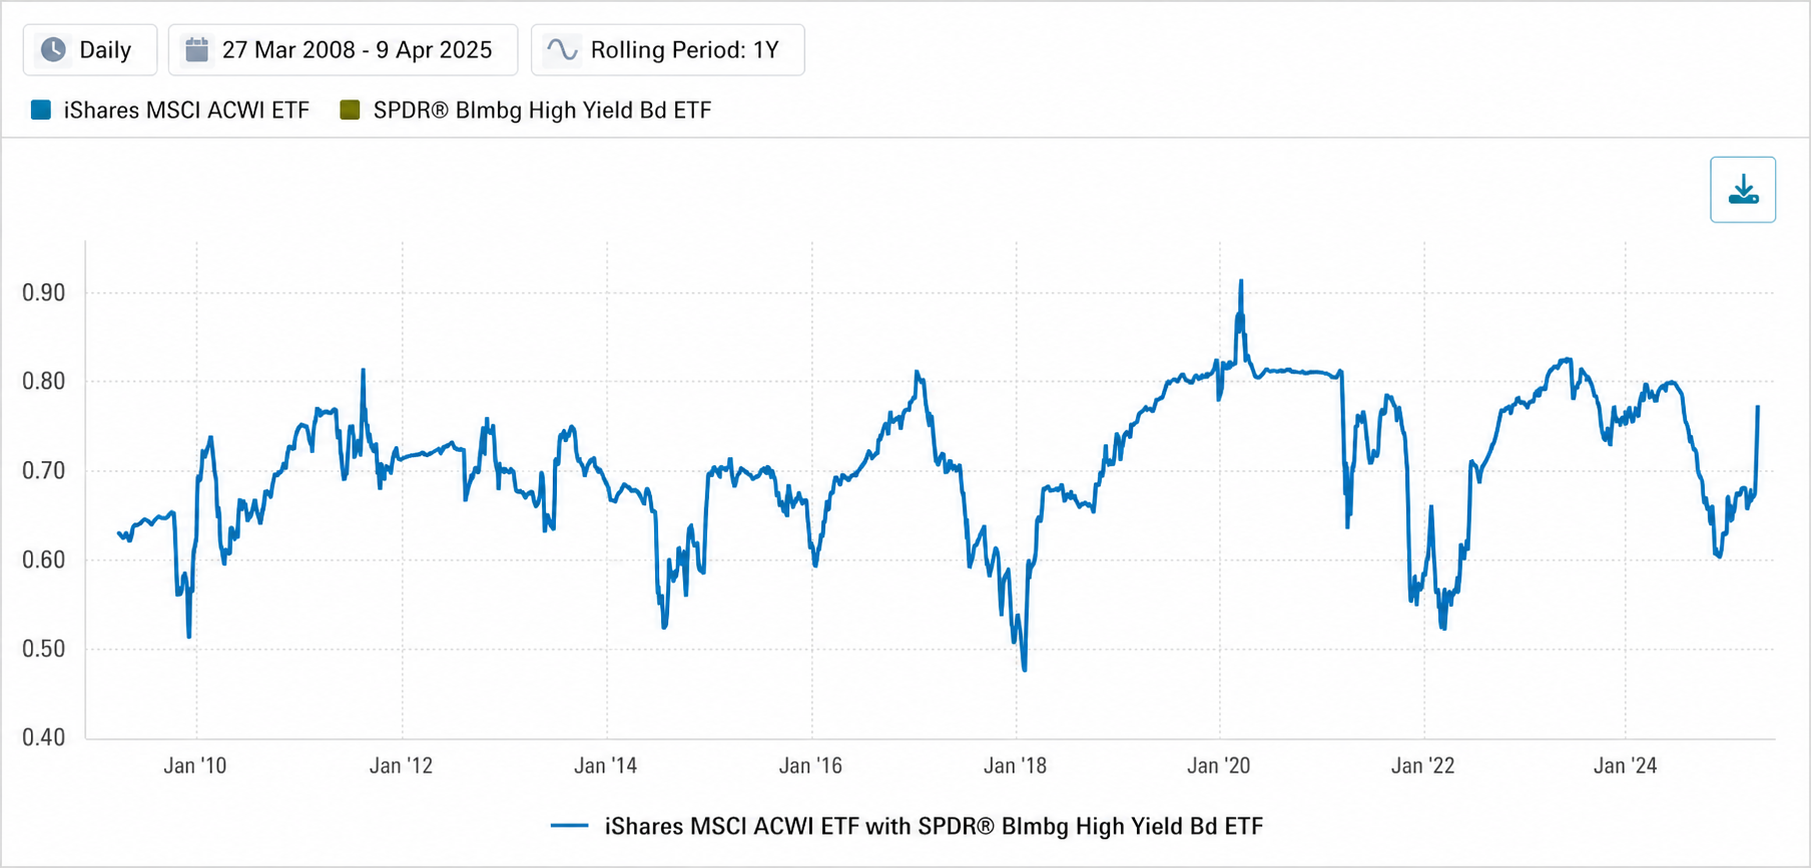
Asset class diversification does not necessarily equate to risk diversification. As shown in Exhibit 1 below, global equities and USD-denominated high-yield bonds have had a correlation of 0.70 since 2008, with a correlation as high as 0.92 over a 1-year time frame.1 In cases like this, illusions of diversification can create serious gaps between expected portfolio performance and reality, especially in times of market distress. This raises the question: why target risk diversification from asset classes when investors can instead diversify by fundamental risks themselves?
-
Investment teams often segment their analysis by individual asset classes, which can lead to misalignment between research and overall portfolio outcomes.
-
Predefining asset class exposure can limit the range of securities available, potentially hindering the achievement of investment goals.
Exhibit 1: Rolling 1-Year Correlation of Global Equities and USD-Denominated High-Yield Bonds
Source: Solovis Risk Pro. Global equities represented by the iShares MSCI ACWI ETF (ACWI). USD-denominated high-yield bonds represented by SPDR Bloomberg High Yield Bond ETF (JNK).
Part 3
What is a Total Portfolio Approach (TPA)?
A TPA moves away from asset classes and labels and instead considers the fundamental risk factors of the total portfolio. These fundamental risks can be found across and within asset classes. For example, a portfolio might have underlying sensitivities to economic growth, interest rates, or foreign currencies, regardless of the specific assets held. TPA can be used as a single, unified method to assess the risk and return of the entire portfolio, rather than evaluating individual investments or sleeves separately. Consider this analogy: if an ACA approach is similar to managing a diet via food groups, then the TPA would be more akin to using a nutritional label instead.
In practice, an equity manager might be compared with a high-yield bond manager when seeking to adjust the portfolio's overall exposure to economic growth. Similarly, combining a real estate manager with a government bond manager could be a way to fine-tune sensitivity to interest rates.
Part 4
What Opportunities Can a Total Portfolio Approach Unlock?
A TPA naturally dismantles siloed decision-making and research, refocusing on how each position contributes to the portfolio’s exposure to fundamental risks. Reorienting research, market views, and investment decisions back to a total portfolio view naturally aligns all stakeholders. This, in turn, can align allocation decisions to total portfolio outcomes, rather than the outcomes of individual asset classes or sleeves.
This alignment may also enhance communication both within teams and externally. Performance and risk reporting through a total portfolio view can simplify messaging by adopting an outcome-oriented approach.
A TPA can also lead to a more precise understanding of risk. By concentrating on independent and fundamental risk drivers across and within asset classes, investors may gain clearer insights into the portfolio’s dynamics. By analyzing each asset in one common language, investors naturally increase the opportunity set to achieve portfolio outcomes. As mentioned earlier, adjusting interest rate exposure for a total portfolio could potentially be achieved via any asset class, not just bonds. This clarity includes identifying the specific contribution of each underlying asset to the total portfolio’s risk.
Part 5
Ways to Use a Total Portfolio Approach
A TPA targets exposure to fundamental risks, but how does one measure exposure to these risks? More importantly, how does one determine which fundamental risks to consider in the first place?
The foundation of a TPA is the use of a factor lens, where each factor represents an independent and fundamental market risk. An example of this is Risk Pro’s Factor Lens, a factor-based risk analysis solution designed to be practical and comprehensive, using a less-is-more approach to support actionable decision-making.
Exhibit 2: Risk Pro’s Factor Lens
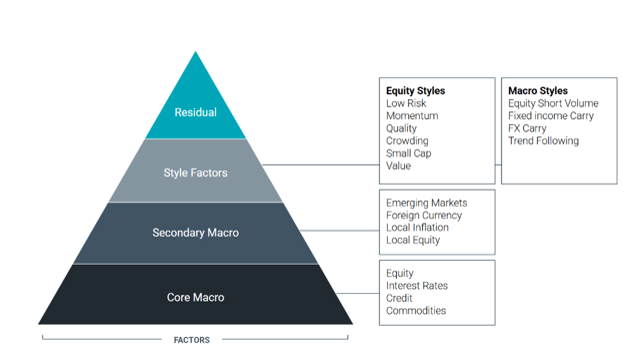
Source: Risk Pro. For illustration purposes only.
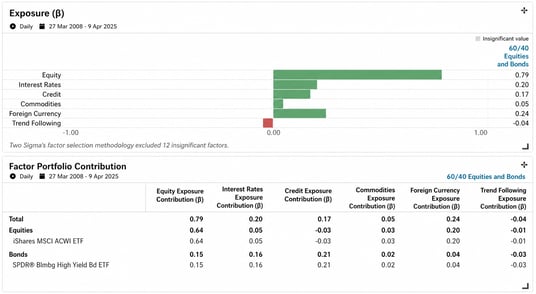
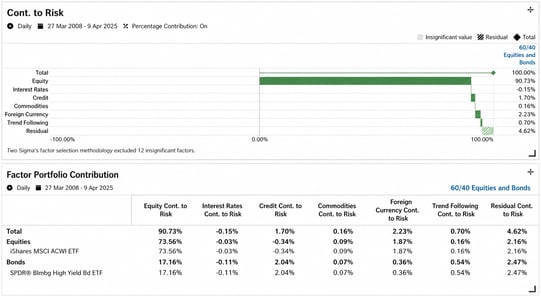
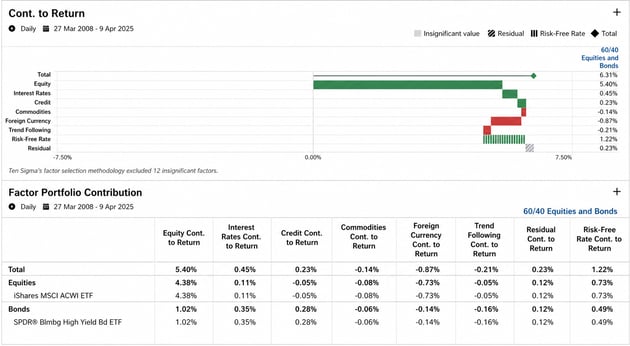
To illustrate an example of total portfolio factor analysis, Exhibit 3 presents a 60/40 portfolio as seen through Risk Pro’s Factor Lens. The goal is to identify the factors that drive this portfolio’s exposure, risk, and return. Importantly, this analysis quantifies each holding's contribution to the total portfolio, enabling actionable insights.
Exhibit 3: Risk Pro’s Factor Lens Exposure, Risk, and Return Analysis Exposure Decomposition
Exposure Decomposition
Risk Decomposition
Return Decomposition
Source: Risk Pro. The 60/40 Equities and Bonds model portfolio used for this analysis rebalances quarterly.
Key Portfolio-level takeaways include:
-
The portfolio has a beta of 0.79 to the Equity factor, with 0.15, or 19% of that Equity exposure, actually driven by the high yield bond sleeve.
-
Over 90% of the total portfolio risk is attributed to the Equity factor.
-
The Foreign Currency factor caused an approximate 90 basis points of drag on return per year, primarily due to the unhedged global equity position.
Part 6
Challenges Associated with Implementing a Total Portfolio Approach
There are three main challenges when implementing a TPA strategy:
-
Building and maintaining a factor lens
-
Preparing data for analysis
-
Bringing together private and public assets
Building and Maintaining a Factor Lens: Crafting a factor lens is complex. With countless potential factors, each must be designed to be as independent as possible while providing substantial explanatory power. If factors are neither independent nor explanatory, risk analysis can become ineffective or misleading. Thus, equal emphasis should be placed on the philosophy of the collective factor lens as well as the selection and construction of individual factors.
Risk Pro’s Factor Lens is constructed with four core pillars:
-
Holistic: by capturing the large majority of cross-sectional and time-series risk for typical institutional portfolios.
-
Parsimonious: by using as few factors as possible.
-
Orthogonal: with each risk factor capturing a statistically uncorrelated risk across assets.
-
Actionable: such that desired changes to factor exposure can be readily translated into asset allocation change.
In addition, the process of ingesting, updating, and scrubbing data needed to maintain a factor lens can be expensive, time consuming, and prone to error. This makes maintaining a factor lens difficult with limited resources or tools such as spreadsheets.
Preparing Data for Analysis: To effectively analyze a total portfolio, it is crucial to ensure that the underlying data is consistent and comparable. This process may involve overcoming challenges such as holdings availability or other data-related issues.
For instance, when hedge funds are part of a portfolio, obtaining timely holdings data can be difficult or even impossible, rendering holdings-based factor analysis unfeasible. One solution is to adopt a returns-based approach to factor analysis, which relies on a regression-based method using already constructed factors, such as those provided by Risk Pro.
By using the time series of returns from an asset, manager, or total portfolio as the only required input, this approach significantly simplifies data requirements. This makes total portfolio analysis much more accessible by reducing data barriers to valuable insights. Risk Pro employs a returns-based methodology but also offers additional insights through holdings data.
Furthermore, the quality of analysis is only as strong as its weakest link. Various proxying techniques can address these challenges, supporting more complete and reliable analysis.
-
Consider a scenario where a manager only has quarterly data, while the rest of the portfolio is available daily. In such cases, using interpolation to convert the quarterly returns into a daily frequency can be beneficial, otherwise all of the information found in daily volatility is essentially lost. This adjustment allows for daily-level total portfolio analysis, providing more detailed insights into risk and attribution.
-
In cases where an asset has a limited historical data set compared to the rest of the portfolio, backfilling with returns from a similar asset with a longer history can be advantageous. This approach enables total portfolio analysis over an extended timeframe, potentially enhancing the accuracy and depth of risk assessment.
Bringing Together Private and Public Assets: The growing popularity of private, or alternative assets, has highlighted the unique data challenges they present. These challenges are evident not only when considering private assets in isolation but also when integrating them into a comprehensive total portfolio that includes public assets.
-
Private assets, not being exchange-traded, are marked to valuation, which can result in returns that lag behind public markets. This delay can cause private assets to experience drawdowns or rallies several quarters after public markets. Additionally, they may exhibit artificially low volatility, complicating risk analysis when combined with public assets. While this may suggest diversification on paper, the reality might differ.
-
Private assets typically report performance on a quarterly basis, often with data that is several quarters outdated. These challenges force a total portfolio view to experience the same issues. Consequently, integrating private and public assets for comprehensive analysis can be impractical without effective data processing.
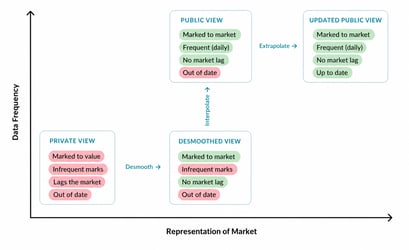
Technologies such as Risk Pro’s Private Asset Lab can help address these issues to view private asset returns through a public lens. For example, desmoothing, interpolation, and extrapolation, can use a public proxy as a reference point to address different challenges of private asset returns. The chart below summarizes the role of each technique at a high level.
Exhibit 4: The Steps to View Private Asset Returns Through a Public Lens
Source: Risk Pro. For illustration purposes only.
Another data-driven way to represent, analyze, and report on private assets within a total portfolio is Risk Pro Daily Private Asset Returns, which are hundreds of ready-to-use, daily, unsmoothed return streams representing various private asset strategies and vintage cohorts. This is achievable by transforming quarterly private fund cash flows into daily return streams by modeling their relationship to public markets.
Importantly, for an investor trying to take a total portfolio view, a best effort to represent a private asset fund alongside liquid assets can be as easy as substituting it with a Risk Pro Daily Private Asset Return, instantly overcoming typical barriers such as artificially low volatility, mistiming with public markets, quarterly marks, or out-of-date data.
Part 7
Looking Beyond Factor Analysis for a Total Portfolio Approach
It is important to recognize that total portfolio analysis extends beyond returns-based factor analysis. For portfolios comprising both private and public assets, managing liquidity is crucial, particularly as private asset funds call committed capital. In such scenarios, technology can facilitate liquidity modeling of the total portfolio.
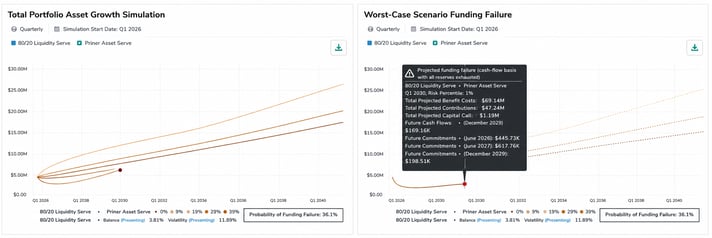
For example, Risk Pro offers Total Portfolio Asset Growth Simulation within its Private Asset Lab. This tool integrates techniques such as cash flow modeling, Monte Carlo simulations, and adjustable inputs such as cash flow parameters or CMA-based forecasts. These methods help investors to estimate the probability of funding failure up to 30 years into the future, providing insights into risks across various scenarios. Exhibit 5 shows an example of this type of liquidity modeling at the total portfolio level.
Exhibit 5: Total Portfolio Asset Growth Simulation and Measuring the Probability of Funding Failure
For a deeper exploration into incorporating private assets into a total portfolio, refer to the guide on Understanding Private Assets.
Part 8
How Risk Pro Enables a Total Portfolio Approach
A TPA challenges the traditional ACA, which can make its adoption intimidating. However, both approaches can be complementary. In fact, comparing their similarities and differences can yield valuable insights into portfolio risks, so many practitioners find merit in combining both perspectives. A TPA is a sharper tool when it comes to understanding the independent and fundamental drivers of risk for a total portfolio, and how each underlying holding contributes to the total portfolio outcome.
For asset owners exploring this approach, Risk Pro provides a cloud-based platform built to facilitate a TPA, with capabilities that address each of its associated challenges. As discussed throughout this guide, this includes providing users with Risk Pro’s Factor Lens for risk analysis, methods to overcome data challenges, as well as ways to analyze private and public assets together.
Contact Solovis to learn more or request a demo.
References:
1Full history correlation measured from 3/27/2008–4/7/2025. The highest rolling 1-year correlation was over the period ending on 3/13/2020. Global equities represented by the iShares MSCI ACWI ETF (ACWI). USD-denominated high-yield bonds represented by SPDR Bloomberg High Yield Bond ETF (JNK).