


-
Looking beyond time series returns, there are structural differences between private and public markets that require specialized tools for deep due diligence.
-
Solovis Risk Pro is developing the Private Asset Lab (PAL), a new module that can increase risk management capabilities in private assets by improving transparency and data accessibility.
-
PAL can project capital calls, distributions, and net asset values, helping investors to better manage their private capital cash flows and asset allocation strategy.
Private and public market investment returns can be driven by the same fundamental risk factors. This laid the foundation for using techniques such as desmoothing, interpolation, and extrapolation to view private assets through a familiar public lens.
Looking beyond time series returns, there are structural differences between private and public markets that require specialized tools for deep due diligence. In fact, in a recent wealth management survey report from CAIS and Mercer, 35% of investment advisors cited due diligence concerns as a barrier to investing in private assets.1
To support existing and potential private market investors, Solovis is developing Risk Pro’s Private Asset Lab (PAL), a new module that can increase risk management capabilities in private assets by improving transparency and data accessibility. Currently in beta, this package of data and tools has been developed with extensive client feedback, purpose-built analytics, and a plan to release deeper private asset capabilities over time.
PAL and Private Market Cash Flows
One example of private asset nuance where PAL can help is cash flow dynamics. In private markets, limited partners (LPs) must commit capital up front to general partners (GPs), who can then call on that capital over time for investment. Similarly, GPs will then distribute profits back to LPs over time. This dynamic, combined with the illiquid and legally binding nature of private asset investing, creates a strong need for cash flow modeling.
Currently in Risk Pro’s PAL, Preqin-sourced cash flow data for close to 7,000 private asset funds, Preqin performance data2 for roughly 18,000 funds, and characteristics for close to 80,000 funds. Using this data, or user-provided data, Risk Pro has the ability to model cash flows, helping investors navigate the flow of transactions between themselves and GPs. Given that cash flow management is a primary consideration for LPs, this article examines associated challenges and Risk Pro’s ability to model cash flows.
Cash Flow Management Challenges in Private Markets
When investing in private markets, the liquidity that LPs need for their committed capital may be unclear. This can lead to suboptimal decision making while waiting for capital to be called, ultimately affecting returns. Similarly, LPs need to make sure they have enough capital on hand to meet commitments, otherwise they risk defaulting on payments.
Switching to the portfolio level, cash flow dynamics come with unique benefits but also more complexity. Assuming vintage diversity,3 a portfolio of private assets allows investors to meet capital calls with distributions from more mature funds. This can lead to a potentially self-sustaining allocation. However, one must manage contributions and distributions simultaneously, maintaining the desired asset allocation in the face of closing and opening funds.
You’ve got a PAL in Me
To help investors better manage their private capital cash flows and asset allocation, Risk Pro’s PAL uses the Takahashi-Alexander Forecast Model (TA Model).4 More specifically, the TA Model projects cash flows and net asset values (NAV) utilizing fund specific inputs alongside model parameters that are calibrated on historical data.5
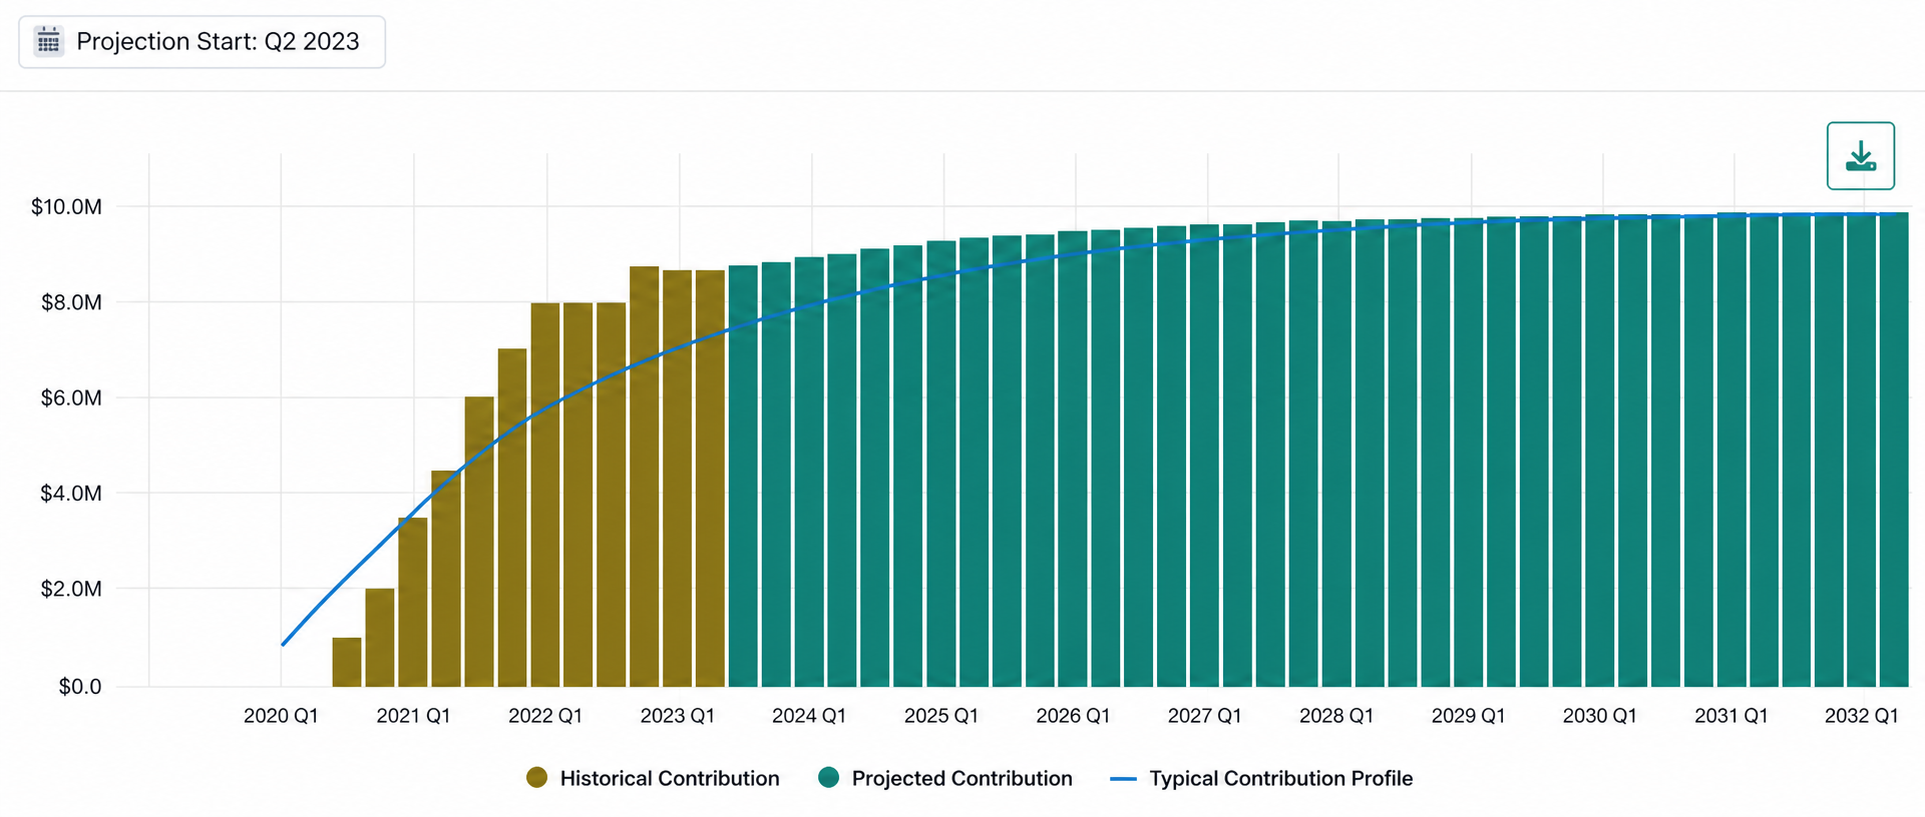
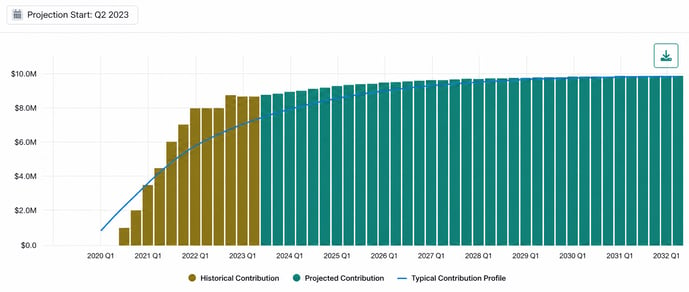
For example, Exhibit 1 shows cumulative contributions to an anonymous balanced private equity fund with $10m capital committed and a vintage of 2019. The chart shows historical (olive), projected (teal), and a typical fund’s (blue)6 cumulative capital called over time. Risk Pro also provides flexibility to view this and other data in non cumulative or table format.
Exhibit 1: Cumulative Contributions of a Private Equity Fund
Source: Solovis Risk Pro
For a hypothetical LP who committed to this strategy, historical data shows roughly $9m of committed capital invested through Q1 2023 (looking at the olive bars). In teal, the projection shows how remaining committed capital might be called in the future. Projected contributions, in conjunction with knowledge that this fund has historically called capital faster than a typical private equity fund, may provide important context as to how much capital an LP might want to keep on hand for Q3 2023 versus Q1 2026, for example.
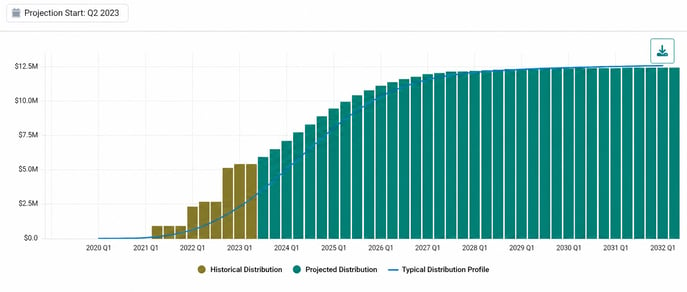
Exhibit 2 shows the same chart for the GP’s distributions back to the LP.
Exhibit 2: Cumulative Distributions of a Private Equity Fund
Source: Solovis Risk Pro
In this example, this fund also distributed back more capital than is typical to the hypothetical LP early in its life cycle. Assuming typical NAV growth, this suggests lower quarterly distributions in the future, but providing the LP with more returned capital than typical through 2028. This may provide confidence that there is flexibility to commit capital to other funds earlier than expected.
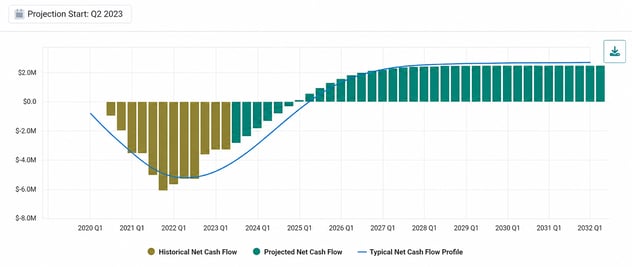
Exhibit 3 shows net cash flow for this strategy, revealing the well known “J-curve” in private assets. This is the idea that cumulative net cash flows begin as negative when capital is being called, but transition to positive as distributions become more prominent.
Exhibit 3: Cumulative Net Cash Flow of a Private Equity Fund
Source: Solovis Risk Pro
Applying Cash Flow Modeling to a Diversified Private Asset Portfolio
As discussed earlier, pacing cash flows for portfolios can address critical challenges such as funding risks and how to maintain a consistent private asset allocation. For example, PAL analysis can be run on Risk Pro’s demo private asset portfolio. This represents a commitment of $20m in capital to each of its 17 holdings across different asset classes and geographies, each with a different vintage year from 2006–2022.
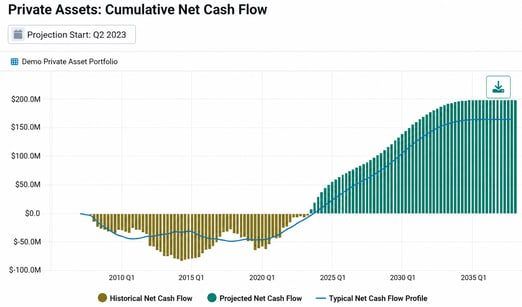
Exhibit 4 shows net cash flows across all funds in the demo portfolio, providing a holistic view of both historical and projected data. For example, after Q4 2021, positive cumulative net cash flow exceeding that of a typical version of the portfolio suggests strong distributions back to investors. This may be due to high growth of the underlying assets, which the next section evaluates.
Exhibit 4: Cumulative Net Cash Flow of a Private Asset Portfolio
Source: Solovis Risk Pro
Using Risk Pro’s PAL for Asset Allocation
NAV represents the value of an individual fund or portfolio at any given time, based on net cash flows but also on realized or assumed growth rates of the underlying investments. If we think about contributions, distributions, and net cash flows as tools for cash flow management, one might consider NAV as a tool for asset allocation.
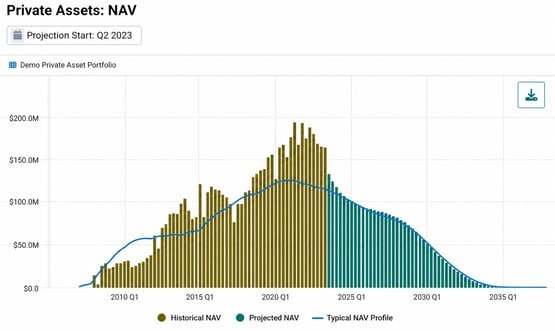
For example, assuming a target of 10% allocation to private assets across a $1b portfolio, when the NAV of the portfolio is above or below $100m the allocation is deviating from its target. This can be critical information when anticipating transactions that may be needed to maintain a certain portfolio weight to private markets.
In Exhibit 5, this may mean selling existing interests around 2018 to 2023 in secondary markets, or committing new capital such that capital calls might begin around 2025, when NAV falls below $100m. As shown, the demo portfolio had strong growth in its underlying assets compared to a typical version of the portfolio, which may have contributed to it ending up with higher than typical cumulative net cash flow in Exhibit 4.
Exhibit 5: Net Asset Value of a Private Asset Portfolio
Source: Solovis Risk Pro
Keeping Up With the Pace of Private Asset Growth
Especially in wealth management, the interest in allocating to private capital is on the rise. For example, using the same report cited earlier, 85% of investment advisors intend to increase allocations to alternative asset classes in the next couple of years, inclusive of private assets.
As private assets continue to grow, so too will the need for tools designed to reduce their complexity while increasing transparency and accessibility. Risk Pro aims to be a leading platform for intuitive and purpose-built private asset analytics, beginning with the first iterations of the Private Asset Lab. Solovis looks forward to continuing to develop PAL, releasing deeper private asset capabilities over time.
Private asset portfolios are less liquid than public asset portfolios and have additional risks, including the risk of loss. Cash flow modeling is dependent on assumptions of uniform fund behaviors according to fund characteristics, and historical data availability. The future cash flow timing and needs of specific investments will differ from the model results, at times significantly. Certain data provided by Preqin Ltd. Copyright 2024 Preqin Ltd. All rights reserved.
References
1 The State of Alternative Investments in Wealth Management
2 In addition to performance data such as Net IRR, Net Multiple, RVPI, and DPI, and % of capital called, Risk Pro’s private asset lab offers Preqin-sourced data such as vintage, status, asset class, strategy, fund manager, fund size, and industry.
3 Vintage: a fund’s first year of investment or capital calls
4 Takahashi, D., and S. Alexander. 2002. “Illiquid Alternative Asset Fund Modeling.” The Journal of Portfolio Management 28 (2): 90.
5 Inputs can include fund start time stamp, as of date time stamp, capital committed, net asset value as of when projections start, and paid-in capital as of when projections start. Applied parameters to this data include rate of contribution, fund life expectancy, a factor describing changes in the rate of distribution over time, quarterly yield (%) and quarterly growth rate (%).
6 “Typical” outputs are model generated cash flows with hyperparameters best reflecting the fund’s universe. For a portfolio, typical represents a bottoms-up typical profile of each individual fund, aggregated into the portfolio level.
To learn more about Risk Pro’s private asset capabilities, contact us.